Adaptive online learning for stock price prediction
Stock price prediction is one of the significant and most difficult tasks in the world of finance. Most traders rely on technical, fundamental & quantitative analysis for making predictions or generating price signals. The dependence of the Stock market on many factors including the unquantifiable human emotions makes the stock prices highly volatile and challenging to predict. With the advancement of Machine learning in many Industries, its ripple effect is also observed in the finance Industry and for the price predictions. Although many people argue that the prices are random walk and no patterns can be found, contrary to this there are strong arguments for the seasonality of the prices and patterns in the stock data. But here comes the main challenge, since stock prices are generated every second there can always be a drift in the data distribution making past data and models obsolete for generating current predictions.

Online learning algorithms can address these problems in a certain manner with Incremental learning approaches. Huge drawback of most of the online learning techniques is that there is no scope for decremental learning (Forget some of the past data) and no flexibility for real-time feature selection. In this article, we discuss the potential of ARTML technique to address the above-mentioned problems for accurately predicting the trend of the stock market. We will implement Naive Bayesian & Linear Discriminant Analysis classification algorithms for predicting the next day’s return (Positive/Negative).
Data Preparation:
For using ARTML for price signal prediction, SPY ETF data from 1993 to 2019 is taken from the Yahoo finance. SPY or S&P 500 is an American stock market index based on the market capitalizations of 500 large companies having common stock listed on the NYSE, NASDAQ, or the Cboe BZX Exchange. The data includes Opening & closing prices, High & low prices and trade volumes for all the trading days from 1993 to 2019. Stock data is generally very clean and no further preprocessing or data cleaning is required other than feature engineering. Return, Standard deviations, and Volume of stocks traded for the different window periods (Window = 2/5/10/20) are created as new features. Since we aim to do real-time feature selection it is always good to start with more number of features and select the best features from them at any point in time.
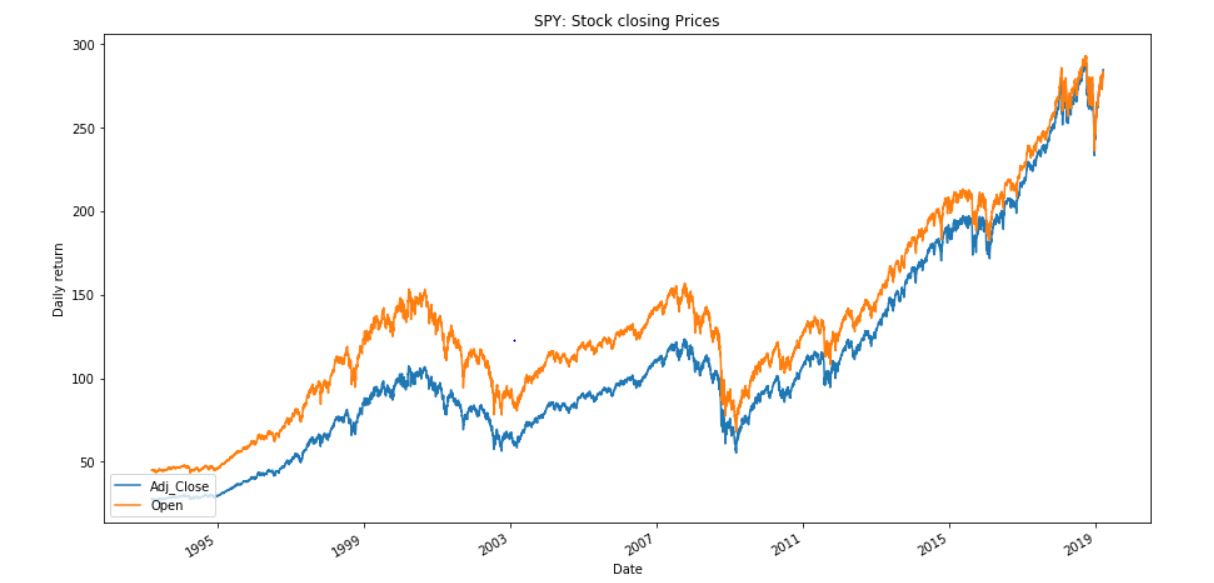
A new feature of ‘return’ is created by considering the next days closing price. If the consecutive trading day closing price is higher than the current closing price then return is considered to be positive/1. Our aim of this project is to build a real-time adaptive model to make this return prediction.
Data Modelling:
Linear Discriminant Analysis (LDA) algorithm is used for making the return predictions in our case. Whole training data is sliced into subsets and LDA model is incrementally trained and tested over an unseen 2018-19 stock data. Since this is a Time series data, we cannot randomly split the data instead data is sliced into different sets in the same order. (In real scenarios we can update the model with the new stock data and use these updated models for making the future predictions.) Here our main goal is to show how the drift in data distribution can be used to update the models to make better predictions. Also, this project does not focus on building the complex trading strategies (features) to increase the prediction accuracies rather its main focus is to show the power of ARTML for addressing the concept drift issues in stock data. When powerful are models built using this powerful ARTML technique, this synergic effect could be a game-changer.
Detailed code and implementation steps for this project can be found in the Jupyter notebook
Results & Model Evaluation:
Binary classification evaluation metrics like Precision/Recall & accuracy can be used for evaluating the model. Since precision represents the number of relevant results, this clearly shows the percentage of positive return predictions made by the model. Also, CAGR (Compound Annual Growth Rate) & Sharpe ratio are calculated for evaluating the trading strategy.
- CAGR: It tells what an investment yields on an annually compounded basis
- Sharpe ratio: It shows the return of an investment compared to its risk.
Model Deployment:
The True power of ARTML can be exploited during the deployment. Once the model with a particular trading strategy is built and deployed, the model can be continuously updated with the ever-increasing new labeled data that is generated every second. When the model gets updated with some anomaly data which is common in the stock market (Variations due to temporary political changes etc.,) ARTML models have the power to forget these data points. Also, Basic element table can be built considering all fundamental, technical & economic factors and only features that gives better classifier performance can be selected in real time. These flexibilities make ARTML highly powerful for real-time stock market predictions.
References:
- https://finance.yahoo.com/quote/SPY?p=SPY
- https://www.investopedia.com/terms/s/sharperatio.asp
- https://www.investopedia.com/terms/c/cagr.asp
- http://cs229.stanford.edu/proj2017/final-reports/5212256.pdf 5.https://www.researchgate.net/publication/309492895_Forecasting_to_Classification_Predicting_the_direction_of_stock_market_price_using_Xtreme_Gradient_Boosting